

Sales Analysis
Generate quick, inspirational sales analyses from actual sales figures. These analyses present a global view without restricting to any section of the business.
- Go to Publishing > Marketing
- Select Analysis on the page top panel toolbar.
- Select type of analysis from the scroll down list.
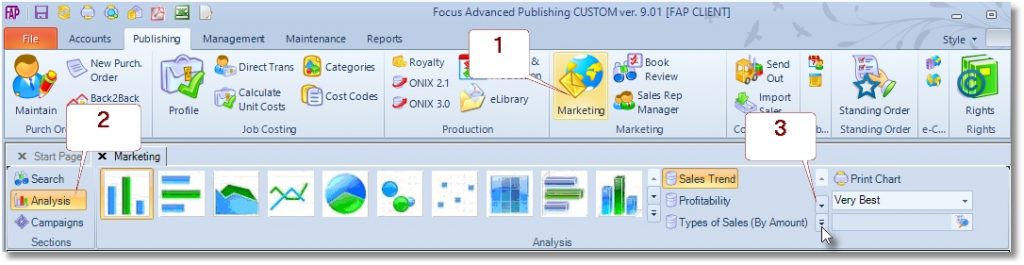
Sales Trend
Click the ‘Sales Analysis’ button on the left panel toolbar to display a sales trend chart for the current year. In this chart, the system analyses the last three years of sales transactions and summarizes their amounts into periods.
Click the ‘Chart’ button and tick the ‘Last Year’ and ‘Prev. Year’ to display all three years, side-by-side on the chart. To change the Base-Year of the analysis, drag the red box.
Best sellers
Select ‘Best Sellers (Amount)’ to analyse by product sales amounts. Select ‘Best Sellers (Quantity)’ to analyse by product sales quantities.
Click the ‘Chart’ button and in the ‘Analyse Stock Sales For’ box, select ‘The Best 5’.
In this chart, the system analyses and summarizes each of the three years of sales transactions by the stock codes and sorts them in the descending order of their sales amounts or sales quantities respectively. It then selects and charts the best n of the stock records where n ranges from 1 to 100.
Best Customers
Select ‘Best Customers’ to analyse by customer sales amounts. Click the ‘Chart’ button and in the ‘Analyse Stock Sales For’ box, select ‘The Best 5’.
In this chart, the system analyses and summarises each of the three years of sales transactions by their branch account codes and sorts them in the descending order of their sales amounts. It then selects and charts the best n of the accounts where n ranges from 1 to 100
Profitability
Click on the ‘Analysis’ button to reveal the pull down menu.
Select ‘Profitability’ to display a profitability analysis.
In this chart, the system analyses and summarizes each of the three years of sales and purchase transactions. It computes and charts the net sales, net purchases and the net profit (net sales – net purchases) for each of the three years.
Best Country
Click on the ‘Analysis’ button to reveal the pull down menu.
Select ‘Best Country’ to analyse by country sales amounts.
In this chart, the system analyses and summarizes each of the three years of sales transactions by their country codes and sorts them in the descending order of their sales amounts. It then selects and charts the best n of the countries where n ranges from 1 to 100
Type of Sales
Select ‘Type of Sales (Amount)’ to analyse by Type of Sales amounts. Select ‘Type of Sales (Quantity)’ to analyse by Type of Sales quantities. In this chart, the system analyses and summarizes each of the three years of sales transactions by the Type of Sales codes and sorts them in the descending order of their sales amounts or sales quantities respectively.Account Type
Select ‘Account Type (Amount)’ to analyse by Account Type amounts. Select ‘Account Type (Quantity)’ to analyse by Account Type quantities. In this chart, the system analyses and summarizes each of the three years of sales transactions by the Account Type codes and sorts them in the descending order of their sales amounts or sales quantities respectively.Chart Setup
For each of the charts mentioned above, you can adjust the chart settings and perform several functions as described below. Click on the Chart button to display a dropdown pad of entry boxes and buttons.
- Chart Type: This dropdown box contains at least ten styles of chart display
- Chart Scale: This dropdown box contains 2 scales of chart display which are LINEAR and PERCENTAGE. Selecting the former will display the chart using the actual amounts. The latter option displays the chart’s values in the scale of 0 to 1.
- Analyse for the Best n: This is a dropdown box containing entries such as the very best, the best 2, the best 3 etc. Selecting an entry will instruct the system of the top number of records to use for the chart display
- Base-Year of Analysis: This is the year on which sales transaction analysis is based which is then compared with other years. To change the base-year, use your mouse and move the box to the required year, that is, This Year, Last Year, or Prev Year buttons.
- Legend: Click on the Legend button to modify the chart title, the footnote text as well as the X and Y axis titles
- Copy Chart: Click on the Copy Chart button to copy the displayed chart which can be pasted onto a word processor/spreadsheet (eg MS Word, Excel) using the ‘Paste Special’ menu option
- Print Chart: Click on the Print Chart button to print out a hard copy of the displayed chart
Create a New Order
Release an Order
Edit an Active Order
Reverse a Done Order
Batch Release and Reprint
Dues invoicing (Backorders)
SOP Error Log
Returns System
Add New, Edit Title Records
Receive Stock (Goods-In) to a Location
Send Out Consignments or Transfer Stock
Process Sales Orders
Do Stocktake
Process Printer/Supplier Invoice
Calculate unit costs
Post Stock Value to Cost of Sales
Add, Classify Edit Accounts
Post Journals
Cash Book
Transfer Money
Post Budgets
Setup Control Accounts
Cost of Sales Overview
Post costs from Purchases
Post Direct Job Transactions
Calculate unit costs
Job Profile / Enquiry
Calculate Royalty
Print, Email Royalty Statements
Post Royalty Payments
Withholding Tax on Royalty
Add Author Records
Set Royalty Rates
Set Rights Royalty